The report displays the aerotriangulation main properties and statistics.
Project Summary
Project
Name of the project.
Number of Photos
The total number of photos given as input.
Ground Coverage
The ground area covered by the project.
Average Ground Resolution
Average size of 1 pixel in 'real world' units. When this value increases, the image spatial resolution decreases
and less details are visible in the reconstruction.
Scale
The ratio of a distance measured in the photos to the corresponding distance on the ground. It is the best scale
to use for 3D printing, considering imagery resolution.
Camera Model(s)
The name of the camera model(s) used to capture the images.
Processing Date
The date of the processing.
Processing Time
The time it took to process the aerotriangulation.
Quality Overview
Dataset
Number of photos that have been successufully positioned after calibration, and will be used to reconstruct the
model.
Keypoints
Number of points of interest automatically detected by ContextCapture in the photos.
Tie Points
Number of tie points of detected by ContextCapture in the photo dataset. A tie point is a 3D point that was identified
in two or more images by corresponding 2D keypoints.
Reprojection Error (RMS)
Reprojection error in pixels. The RMS value represents the square root of the average of the squared reprojection
errors computed for each generated tie point.
Positioning / Scaling
Indicates whether the images are georeferenced, and if the project uses control points or scale constraints.
Camera Calibration
During camera calibration, ContextCapture estimates the parameters of the lens and image sensor for all cameras used
to acquire the photos. For each individual camera, this section details the estimated calibration results and
distortion grid.
Calibration Results
For an individual camera, the initial calibration values and the optimized results are listed, together with the
difference between them.
Camera Parameters for Perspective Lens
Focal Length [mm]
Focal Length Equivalent 35 mm [mm]
Principal Point X [pixels]
Principal Point Y [pixels]
K1
K2
K3
P1
P2
Previous Values
24.00
24.00
Optimized Values
24.53
24.53
2878.57
1570.15
-0.0964
0.0918
-0.0244
0
0
Difference Previous / Optimized
0.53
0.53
Previous Values
The values used as initial values for camera calibration. They can come from a camera model, or from a previous
calibration.
Optimized Values
The optimized values that are computed from the camera calibration and that are used for processing.
Difference Previous / Optimized
The difference between the optimized values and the previous values (input values), when previous values
exist.
Focal Length
The focal length of the camera.
Focal Length Equivalent 35 mm
The focal length needed in a 35 mm camera to obtain the same angle of view as the real lens-sensor combination.
Principal Point X
The X image coordinate of the principal point, in pixels. The principal point is located around the center
of the image. The point (0,0) is located in the upper left corner of the image.
Principal Point Y
The Y image coordinate of the principal point, in pixels. The principal point is located around the center
of the image. The point (0,0) is located in the upper left corner of the image.
K1
The 1st radial distortion coefficient.
K2
The 2nd radial distortion coefficient.
K3
The 3rd radial distortion coefficient.
P1
The 1st tangential distortion coefficient.
P2
The 2nd tangential distortion coefficient.
Camera Parameters for Fisheye Lens
Focal Length [mm]
Focal Length Equivalent 35 mm [mm]
Principal Point X [pixels]
Principal Point Y [pixels]
P0
P1
P2
P3
P4
Previous Values
15.00
15.00
Optimized Values
15.00
15.00
2703.26
1811.04
0
1
-0.0112
-0.0683
0
Difference Previous / Optimized
0.00
0.00
Previous Values
The values used as initial values for camera calibration. They can come from a camera model, or from a previous
calibration.
Optimized Values
The optimized values that are computed from the camera calibration and that are used for processing.
Difference Previous / Optimized
The difference between the optimized values and the previous values (input values), when previous values
exist.
Focal Length
The focal length of the camera.
Focal Length Equivalent 35 mm
The focal length needed in a 35 mm camera to obtain the same angle of view as the real lens-sensor combination.
Principal Point X
The X image coordinate of the principal point, in pixels. The principal point is located around the center
of the image. The point (0,0) is located in the upper left corner of the image.
Principal Point Y
The Y image coordinate of the principal point, in pixels. The principal point is located around the center
of the image. The point (0,0) is located in the upper left corner of the image.
P0
The 1st distortion coefficient.
P1
The 2nd distortion coefficient.
P2
The 3rd distortion coefficient.
P3
The 4th distortion coefficient.
Distortion Grid
Visualization of the estimated lens distortion, combining radial and tangential distortion.
Camera Lens Distortion: Gray lines represent the zero distortion grid, and blue lines represent the real camera
values.
This image illustrates the lens distortion, that is the degree to which the lens produces curved lines where
straight lines should be. Lens distortion is a common effect for most types of camera, and is taken into
account by ContextCapture during processing.
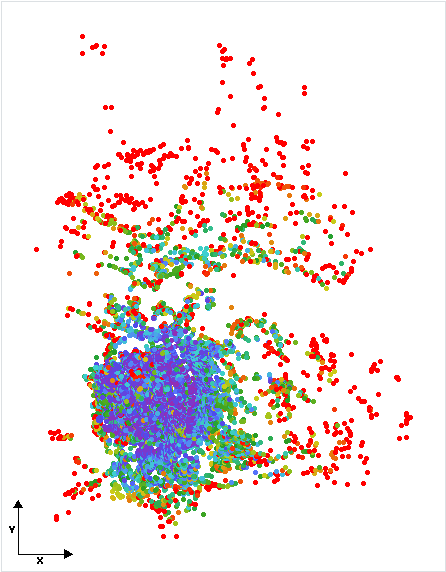
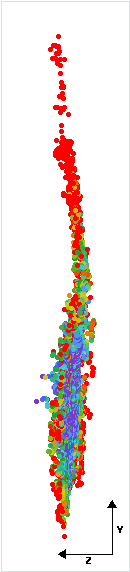
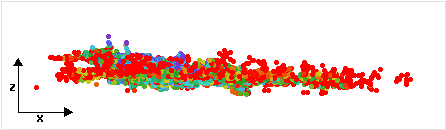
Photo Positions
This section uses a series of metrics to define the computed photo positions and to help the user identify potential
errors in positioning.
Section
"Photo Position Uncertainties" illustrates to what point the ContextCapture optimization is certain of the
estimated photo position. The larger the ellipse around a photo position, the bigger the uncertainty.
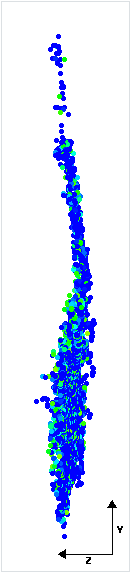
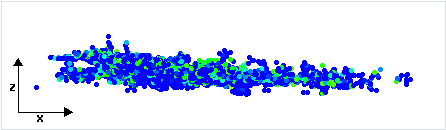
Position Uncertainties: Top view (XY plane), side view (ZY plane) and front view (XZ plane) of computed photo
positions (black dots). Blue ellipses indicate the position uncertainty, scaled for
readability. The minimum and maximum values, as well as the average value, can be
found in the
Position Uncertainties table.
Direction and magnitude of camera position uncertainty. The uncertainty is represented as a 3D ellipsoid
projected on 3 planar views.
Position Uncertainties
X [meters]
Y [meters]
Z [meters]
Minimum
0.0013
0.0012
0.0014
Mean
0.002
0.0018
0.0022
Maximum
0.003
0.0031
0.0034
Minimum X/Y/Z
Minimum uncertainty in the X/Y/Z direction of the computed camera positions.
Mean X/Y/Z
Mean uncertainty in the X/Y/Z direction of the computed camera positions.
Maximum X/Y/Z
Maximum uncertainty in the X/Y/Z direction of the computed camera positions.
Distance to Input Positions shows through arrows and colors the distance between the input positions provided
by the user and the optimized values. This section is only present if input positions are provided.
Position Distance to Metadata: Top view (XY plane), side view (ZY plane) and front view (XZ plane), with arrows indicating
the offset between the metadata positions and the computed photo positions; all arrows
start from the metadata positions and point toward the computed positions. Gray points
indicate uncalibrated photos that have metadata. Pink points
indicate calibrated photos that have no metadata.
3D arrows link each input camera position (starting point) to the corresponding optimized position (end point,
represented by the arrow head). The 2D views are a projection of these 3D arrows onto the XY, ZY and
XZ planes. Arrow are colored according to their 3D length, with very long arrows being red.
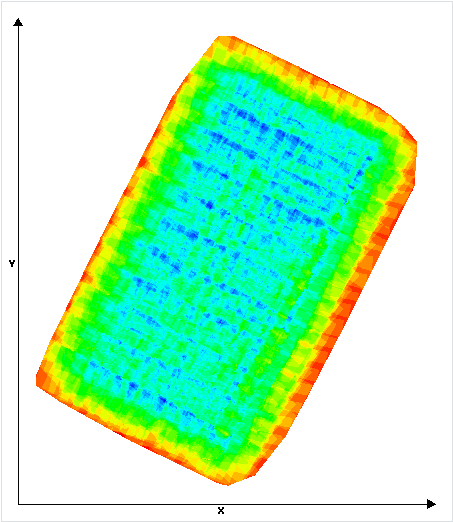
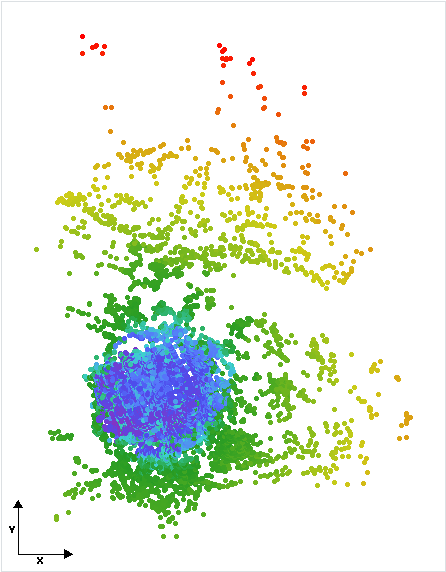
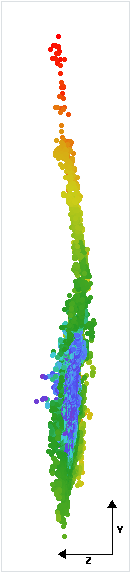
Section Scene Coverage shows through colors the number of photos that potentially see each area.
Number of photos seeing the the scene: Top view (XY plane) display of the scene, with colors indicating the number of photos that potentially see each area.
This image illustrates the amount of information the project has about the scene by coloring each scene area according to the number of photos that can see it.
Photo Matching
Photo matching looks at the automatically generated tie points – that match all photos together – and
uses various quality measures to validate the correctness of the matching, or to try and pinpoint potential problems.
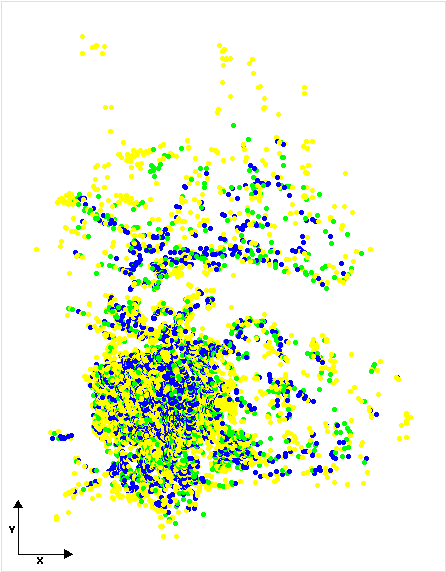
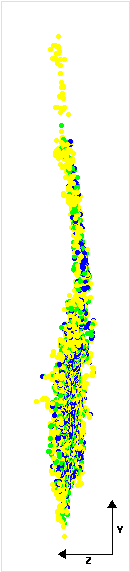
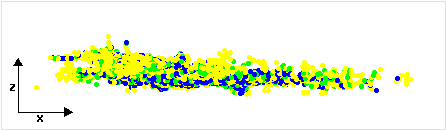
Quality Measures on Tie Points
Section
"Tie Point Position Uncertainties" visually represents uncertainty in the individual tie point position.
Position Uncertainties: Top view (XY plane), side view (ZY plane) and front view (XZ plane) displays of all tie points,
with colors representing uncertainty in the individual point position. The values are
in meters, with a minimum uncertainty of
0.0041 meters and a maximum of
2.079 meters. The median position uncertainty equals
0.0916 meters.
Number of Photos Observing the Tie Points illustrates the number of photos that have been used to define
each point.
Number of Observations per Tie Point: Top view (XY plane), side view (ZY plane) and front view (XZ plane) displays of all tie points,
with colors representing the number of photos that have been used to define each point.
The minimum number of photos per tie point is
3 and the maximum is
48. The average number of photos observing a tie point is
5.
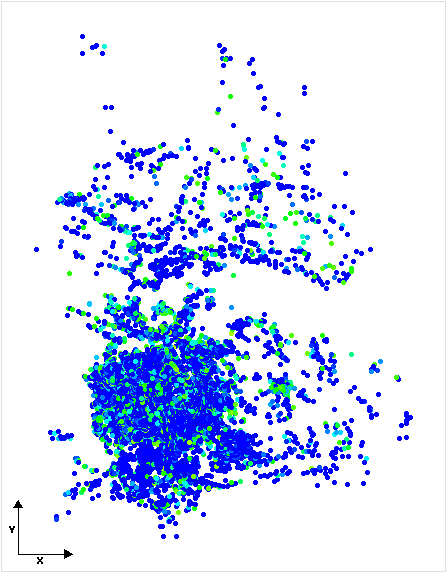
Reprojection Error consideres the pixel reprojection error for each tie point, and shows the graphical representation
of these values in a top, side and front view of the scene.
Reprojection Errors per Tie Point: Top view (XY plane), side view (ZY plane) and front view (XZ plane) displays of all tie points,
with colors representing the reprojection error in pixels. The minimum reprojection error
is
0.01 pixels and the maximum is
1.71 pixels. The average reprojection error is
0.43 pixels.
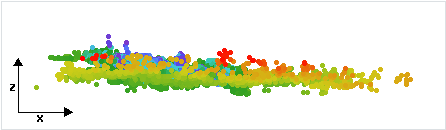
Tie Point Resolution displays the multiview projection of all tie points, with colors representing resolution
in the individual point position.
Resolution: Top view (XY plane), side view (ZY plane) and front view (XZ plane) displays of all tie points,
with colors representing resolution in the individual point position. The values are
in meters/pixel, with a minimum resolution of
0.012 meters/pixel and a maximum of
0.0967 meters/pixel. The median resolution equals
0.0202 meters/pixel.
Distance to Point Clouds
This section is present only in the case of projects that combine photos and scans. When an adjustment was performed by the algorithm to try to align the photos to the scans, a table detailing the measured distances is shown in the report.
Distance between Tie Points Extracted from Photos and Scans
Initial values
Optimized values
Overlap (Number of points at < 0.5 units)
Number of points at < 0.01 units
Overlap (Number of points at < 0.5 units)
Number of points at < 0.01 units
Scan 1
89554 (45.29% of the total number of tie points)
11113 (5.62% of the total number of tie points) (12.41% of the overlap)
89744 (45.38% of the total number of tie points)
20665 (10.45% of the total number of tie points) (23.03% of the overlap)
Scan 2
66784 (33.77% of the total number of tie points)
5227 (2.64% of the total number of tie points) (7.83% of the overlap)
66910 (33.84% of the total number of tie points)
11402 (5.77% of the total number of tie points) (17.04% of the overlap)
Global Distance
136298 (68.93% of the total number of tie points)
14108 (7.13% of the total number of tie points) (10.35% of the overlap)
136588 (69.07% of the total number of tie points)
27693 (14% of the total number of tie points) (20.27% of the overlap)
Initial values
Initial distances between the tie points extracted from photos and the point clouds.
Optimized values
Optimized distances between the tie points extracted from photos and the point clouds.
Overlap
Number of tie points that are considered as overlapping the scan. These are the points that ContextCapture tries to fit as closely as possible to the scan.
Additional graphics detail the measured distances, first for the entirety of the scene captured by the point clouds, and then for each scan individually.
Details on Tie Point Distance to Point Clouds: Comparison between initial positions of the tie points, and the optimized values obtained after considering the point clouds.
Surveys
This section details information about user-defined survey points.
Control Points section is displayed if control points have been used. A table including detailed data for
each control point, and their estimated position error is included in this section. Additionally, an orange or
red flag draws attention to overly big reprojection errors.
The flags are colored according to reprojection error value (or to the RMS of this value), with the following rules:
Colored flag
RMS of Reprojection Errors [pixels]
Accuracy Level
< 1 pixel
High
[1 pixel, 3 pixels[
Medium
> 3 pixels
Low
Control Points Errors
Name
Category
Accuracy [meters]
Number of Photos
RMS of Reprojection Error [pixels]
RMS of Distances to Rays [meters]
3D Error [meters]
Horizontal Error [meters]
Vertical Error [meters]
gps9
3D
Horizontal: 0
Vertical: 0
4
0
0.0001
0
0
0
gps5
3D
Horizontal: 0
Vertical: 0
3
0
0.0003
0.0005
0.0003
0.0004
GPS0003
3D
Horizontal: 0
Vertical: 0
3
0.01
0.0002
0.0003
0.0002
-0.0002
Global RMS
0
0.0002
0.0003
0.0002
0.0002
Median
0
0.0002
0
0
0
Name
The name of the control point.
Category
Indicates whether the control point has a full 3D position or only horizontal (X,Y) / vertical (Z) coordinates.
Accuracy
User-given point accuracy. The horizontal accuracy indicates the estimated accuracy in the input X and Y
coordinates. The vertical accuracy indicates the estimated accuracy in the input Z coordinate. Control
points with a higher accuracy have more weight in the aerotriangulation.
Number of Photos
The number of photos in which the control point is seen.
RMS of Reprojection Error
Reprojection error in pixels. The RMS is the root mean square of the point's reprojection errors in all photos
that see it.
RMS of Distances to Rays
The square root of the average of the square distances to rays. A ray is the 3D line that starts from a photo
position and passes through the control point position observed in that photo. The orthogonal distance
from the real point 3D position to that ray is the distance to ray.
3D Error
Distance in meters (or units) between the given 3D position and the estimated 3D position.
Horizontal Error
Horizontal distance in meters (or units) between the given 3D position and the estimated 3D position.
Vertical Error
Vertical distance in meters (or units) between the given 3D position and the estimated 3D position.
Global RMS
The root mean square of the corresponding column values.
Median
The median of the corresponding column values.
User Tie Points section is displayed if manually defined tie points have been used. As for control points,
a table detailing information on each point is included, and an orange or red flag draws attention to big reprojection
errors:
Colored flag
RMS of Reprojection Errors [pixels]
Accuracy Level
< 1 pixel
High
[1 pixel, 3 pixels[
Medium
> 3 pixels
Low
User Tie Points Errors
Name
Number of Photos
RMS of Reprojection Error [pixels]
RMS of Distances to Rays [meters]
User tie point #1
3
0.53
0.0094
User tie point #2
3
0.43
0.0068
Global RMS
0.48
0.0082
Median
0.53
0.0094
Name
The name of the user tie point.
Number of Photos
The number of photos in which the user tie point is seen.
RMS of Reprojection Error
Reprojection error in pixels. The RMS is the root mean square of the point's reprojection errors in all photos
that see it.
RMS of Distances to Rays
The square root of the average of the square distances to rays. A ray is the 3D line that starts from a photo
position and passes through the user tie point position observed in that photo. The orthogonal distance
from the real point 3D position to that ray is the distance to ray.
Global RMS
The root mean square of the corresponding column values.
Median
The median of the corresponding column values.
Positioning Constraints section is displayed if constraints are defined on the user tie points. A list detailing information on each constraint is included, with some additional data in the case of scale constraints:
4 positioning constraint(s):
Origin constraint: O='Up right corner'.
Axis constraint: A='Bottom right corner'; B='Up right corner'; line AB=z axis.
Scale constraints (2):
Definition
Given Distance [units]
Estimated Distance [units]
Error [units]
A='Up right corner'; B='Up left corner'
10
9.6298
0.3702
A='Up right corner'; B='Bottom right corner'
20
20.1767
0.1767
Photos Report
This report presents detailed information about each photo. Sections are organized by the type of information (for example,
uncertainty in position or number of connections); inside each section, a first table presents the photo(s) with
the worst performance according to that particular measure. A second table lists
all photos and their corresponding values.
Positioning Uncertainty
This section lists the position uncertainty for each photo; in other words, it shows to what point ContextCapture
optimization is certain of the estimated photo position.
A first table enumerates the photo(s) with a greater positional uncertainty. Note that while these photos have the
worst position certainty score in the dataset, it does not follow that they are badly placed. It might well be
that all photos are positioned with very little uncertainty by ContextCapture, and even the worst values are
in effect very good.
A second, lengthy table, lists all photos in the dataset, with their corresponding uncertainty values.
Photo
Camera Model
X [meters]
Y [meters]
Z [meters]
0Z5A9686.JPG
Canon EOS 5D Mark III EF24mm f/2.8 IS USM 24mm 5760x3240
0.00204531
0.00168599
0.00149838
0Z5A9687.JPG
Canon EOS 5D Mark III EF24mm f/2.8 IS USM 24mm 5760x3240
0.00199468
0.0015959
0.00143171
0Z5A9688.JPG
Canon EOS 5D Mark III EF24mm f/2.8 IS USM 24mm 5760x3240
0.00202417
0.00159718
0.00140845
Photo
The name of the photo.
Camera Model
The name of the camera model used to take the photo.
X/Y/Z
The position uncertainty in the X/Y/Z direction.
Photo Distance to Input Positions
This section lists the distance between the input photo positions provided by the user and the optimized positions
computed by ContextCapture. It is only present in the report if input positions are available.
A first table enumerates photos with a greater photo distance to the input positions (5% of the dataset containing
the greatest difference in positions). Note that while this table is provided for easy identification of potential
problems, it does not imply that the listed values are actually not acceptable. It is up to the user to decide
on a case by case basis whether the computed distances are accurate enough for their requirements.
A second table lists all photos in the dataset, with their corresponding input and computed positions, and the distance
between these two positions.
Photo
Computed Position
Input Position
Photo
Camera Model
X
Y
Z
X
Y
Z
Distance
0Z5A9686.JPG
Canon EOS 5D Mark III EF24mm f/2.8 IS USM 24mm 5760x3240
-23.2351
-42.3024
507.846
-23.3265
-42.2932
507.915
0.114434
0Z5A9687.JPG
Canon EOS 5D Mark III EF24mm f/2.8 IS USM 24mm 5760x3240
-23.0311
-42.2521
507.563
-23.119
-42.2414
507.633
0.112321
0Z5A9688.JPG
Canon EOS 5D Mark III EF24mm f/2.8 IS USM 24mm 5760x3240
-20.3249
-42.7505
507.832
-20.4048
-42.7428
507.903
0.107306
Photo
The name of the photo.
Camera Model
The name of the camera model used to take the photo.
Computed Position X/Y/Z
The X/Y/Z value of the optimized photo position.
Input Position X/Y/Z
The X/Y/Z value of the input photo position.
Distance
The distance between the input photo position and the optimized position.
Generated Tie Points
This section details the number of keypoints and tie points automatically extracted for each image. In addition,
each photo has error metrics attached to it that give a measure of how well matched the photo truly is.
Two tables are present in this section:
the first table lists the photos where the tie points have a greater reprojection error (5% of the dataset containing
the greatest errors);
the second table enumerates all photos in the dataset, and gives their corresponding number of tie points and reprojection
error.
To easily detect problematic photos, a flag is attached to each on eof them, colored according to the reprojection
error value (or to the RMS of this value). The following rules apply:
Colored flag
RMS of Reprojection Errors [pixels]
Accuracy Level
< 1 pixel
High
[1 pixel, 3 pixels[
Medium
> 3 pixels
Low
Photo
Processed Values
Photo
Camera Model
Number of Key Points
Number of Tie Points
RMS of Reprojection Errors [pixels]
RMS of Distances to Rays [meters]
0Z5A9686.JPG
Canon EOS 5D Mark III EF24mm f/2.8 IS USM 24mm 5760x3240
45416
1666
0.504194
0.00827829
0Z5A9687.JPG
Canon EOS 5D Mark III EF24mm f/2.8 IS USM 24mm 5760x3240
45891
1730
0.472052
0.00805313
0Z5A9688.JPG
Canon EOS 5D Mark III EF24mm f/2.8 IS USM 24mm 5760x3240
45689
1773
0.476695
0.00824229
Photo
The name of the photo.
Camera Model
The name of the camera model used to take the photo.
Number of Key Points
The number of key points present in the image. A key point is a point that has been observed on at least
two images.
Number of Tie Points
Number of the points present in the image. A tie point is a key point that has been judged accurate and is
retained as a 3D point after calibration.
RMS of Reprojection Errors
Reprojection error in pixels. The RMS is the root mean square of the errors in reprojection of all tie points
seen in the photo.
RMS of Distances to Rays
The square root of the average of the square distances to rays. A ray is the 3D line that starts from the
photo position and passes through a tie point position observed in that photo. The orthogonal distance
from the real point 3D position to that ray is the distance to ray.
Connections
This section details the number of connections each photo has. Photos that are considered to have weak connections
(5% of the dataset containing the least connections), are listed in a first table. A second table gives the entire
list of photos, with the corresponding connection number.
Photo
Previous Values
Processed Values
Photo
Camera Model
Number of Tested Pairs
Number of Connected Photos
Number of Connected Photos
0Z5A9686.JPG
Canon EOS 5D Mark III EF24mm f/2.8 IS USM 24mm 5760x3240
8
2
65
0Z5A9687.JPG
Canon EOS 5D Mark III EF24mm f/2.8 IS USM 24mm 5760x3240
10
65
0Z5A9688.JPG
Canon EOS 5D Mark III EF24mm f/2.8 IS USM 24mm 5760x3240
9
65
Photo
The name of the photo.
Camera Model
The name of the camera model used to take the photo.
Number of Tested Pairs
The number of possible connections tested for this photo.
Number of Connected Photos
The number of photos with which the given photo has tie-points in common.
Survey Points
This section enumerates survey point data for each photo.
If the project has control points, a table is included listing the photo(s) where the control points are least certain
(worst ones in the dataset). Another table details the number of control points for each photo and their averaged
reprojection error.
Photo
Previous Values
Processed Values
Photo
Camera Model
Number of Points
RMS of Reprojection Errors [pixels]
RMS of Distances to Rays [meters]
Number of Points
RMS of Reprojection Errors [pixels]
RMS of Distances to Rays [meters]
0Z5A9686.JPG
Canon EOS 5D Mark III EF24mm f/2.8 IS USM 24mm 5760x3240
0
1
0.0101665
0.000178274
0Z5A9690.JPG
Canon EOS 5D Mark III EF24mm f/2.8 IS USM 24mm 5760x3240
0
1
0.0156892
0.000212372
Photo
The name of the photo.
Camera Model
The name of the camera model used to take the photo.
Number of Points
The number of control points present in the photo.
RMS of Reprojection Errors
Reprojection error in pixels. The RMS is the root mean square of the errors in reprojection of all control
points seen in the photo.
RMS of Distances to Rays
The square root of the average of the square distances to rays. A ray is the 3D line that starts from the
photo position and passes through a control point position observed in that photo. The orthogonal distance
from the real point 3D position to that ray is the distance to ray.
In the same way, if the project has user tie points, a table is included listing the photo(s) where the user tie
points are least certain (worst ones in the dataset). Another table details the number of user tie points for
each photo and their averaged reprojection error.